Histogram
Histograms are one of the most basic statistical tools that we have.
- divide into bins: the taller the stack within a bin, the more measurements we made that fall into that bin. (figure out how wide is the bin is a tricky)
- we can use histogram to predict the probability of getting future measurements
- If you want to use a “distribution” to approximate your data (or future measurements). Histograms are a good way to justify your decision.
- normal distribution
- exponential distribution
Distribution
- we can use a curve to approximate the histogram. The curve tells us the same thing that the histogram tells us.
- advantage over Histogram
- we can use the curve to calculate the probability
- the curve is not limited by the width of the bins
- if we don’t have enough time or money to get a ton of measurements. The approximate curve (based on the mean and standard deviation of the data we were able to collect), is usually good enough
- both the histogram and the curve are Distributions
- show us how the probabilities of measurements are distributed.
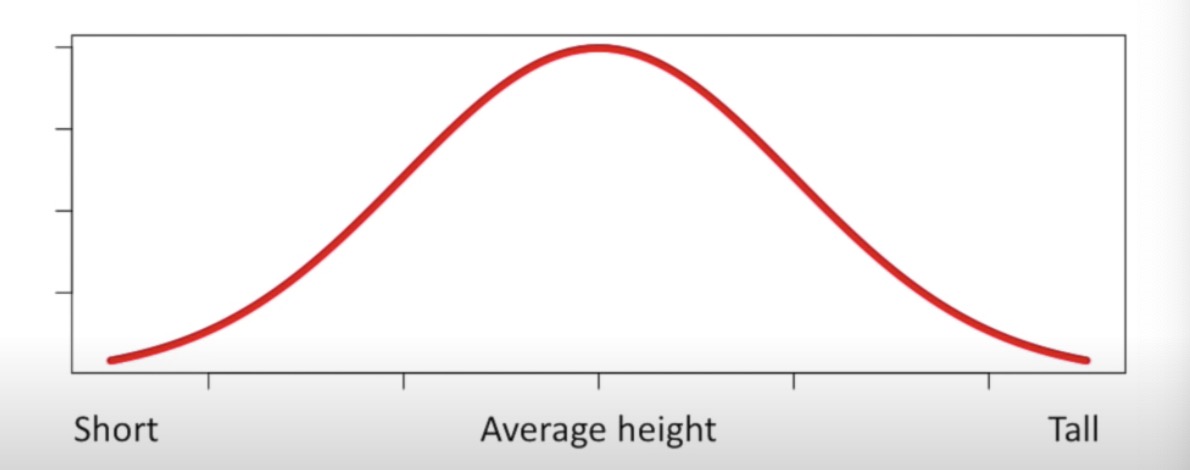
The Normal Distribution
- Normal/Gaussian distribution: it is also called a “bell shaped curve” because it is a symmetrical curve

- To draw a normal distribution, you need to know:
- The average measurement. This tells you where the center of the curve goes
- The standard deviation of the measurements, this tells you how wide the curve should be. And the width of the curve determines how tall it is. The wider the curve the shorter. The narror the curve, the taller.
- The Central Limit Theorem
- the normal distribution is kind of magical in that we see it a lot in nature. But there is a reason for that, and that reason makes it super useful for statistics as well.
Population Parameters
- Population: whatever unit it is you are measuring something awesome
- Population parameters: the parameters that determine how a distribution fits the population data
Normal distribution
The mean and standard deviation of the normal curve, which represents the population, are called Population parameters
- population Mean
- population Standard Deviation
Exponential Distribution
we could use the exponential distribution to calculate probabilities and statistics just like when we had a Normal Distribution
- population rate
Gamma Distribution
- population rate
two parameters:
- population shape
- population rate
the reason why we want to know the population parameters is to ensure that the results drawn from our experiment are reproducible
the more data that we have, the more confidence we can have in the accuracy of the estimates. One of the main goals in statistics is quantifying how much confidence we can hsve in population estimates
- specially, statisticians often calculate p-values and confidence intervals to quantify the confidence in the estimated parameters
Estimating the Mean, Variance and Standard Deviation
- sample mean: statisticians often use the symbol x-bar to refer to the estimated mean == sample mean and they use the Greek symbol U(mu) to refer to the population mean
- The estimated mean is different from the population mean, but with more and more data, x-bar should get closer and closer
- population variance and standard deviation
- determine how wide to make the curve
- we want to calculate how the data are spread around the population mean

- in the variance the unit is squared.
- the population variance is the average of the squared differences between the data and the population mean U.
- we square these differences to prevent the ones on the left from canceling the ones on the right, and then take the average
- population standard deviation:
- square root of population variance
- the standard deviation is the original units that we measured, we can draw it on the graph.
- estimated population variance
- change population mean to estimated population mean
- change n to n-1: dividing by n-1 compensates for the fact that we are calculating differences from the sample mean instead of the population mean
- estimated population standard deviation
- square root of estimated population variance
- Summary
- if we have all of the data from a population, we can calculate the population mean. when we don’t have the population data, we can estimate the population mean with the same formula
- when we have the population data, we can calculate the population variance and standard deviation
- However, we almost never have the population data so chances are you should not use these formulas. Instead, we almost always estimate the variance and standard deviation
What is a Model
- we use models to explore relationships
- we use statistices to determine how useful and how reliable our model is.
Hypothesis Testing, Null Hypothesis and Alternative Hypothesese
We can create a hypothesis, and if data give us strong evidence that the hypothesis is wrong, then we can reject the hypothesis.
But when we have data that is similar to the hypothesis, but not exactly the same then the best we can do is fail to reject the hypothesis
Null Hypothesis: the hypothesis that is no difference between things
- the Null Hypothesis does not require preliminary data, because the only value that represents no difference is 0.
in the statistical test, it needs three things
- it needs datas
- it needs a Null or Primary Hypothesis (i.e. it needs something to reject or fail to reject)
- it needs alternative hypothesis
When we only have two groups of data, the Alternative Hypothesis is pretty obvious because it is simply the opposite of the Null Hypothesis