PyTorch Tutorial - Linear Model

Linear Model

1
2
3
4
5
6
7
8
9
10
11
12
13
14
15
16
17
18
19
20
21
22
23
24
25
26
27
28
29
30
31
32
33
34
35
36
37
38
39
40
# 1. import libraries
import numpy as np
import matplotlib.pyplot as plt

# 2. Dataset
x_data = [1,2,3]
y_data = [2,4,6]

# 3. Design Model
def forward(x,w):
return x*w

# 4. define loss function
def loss(x, y, y_pred):
# y_pred = forward(x)
loss = (y_pred - y) **2
return loss

# create lists to store weights and mse result
w_list = []
mse_list = []

# Exhaustive Attack method/Brute Force Method
# get MSE under different weights
for w in np.arange(0.0, 4.1, 0.1):
l_sum = 0
for x_val, y_val in zip(x_data, y_data):
y_pred_val = forward(x_val, w)
loss_val = loss(x_val, y_val, y_pred_val)
l_sum += loss_val
print("\t", x_val, y_val, y_pred_val, loss_val)
print("MSE=", l_sum/len(x_data))
w_list.append(w)
mse_list.append(l_sum/len(x_data))

# visualization
plt.plot(w_list, mse_list)
plt.ylabel("Loss")
plt.xlabel('w')
plt.show()

Assignment

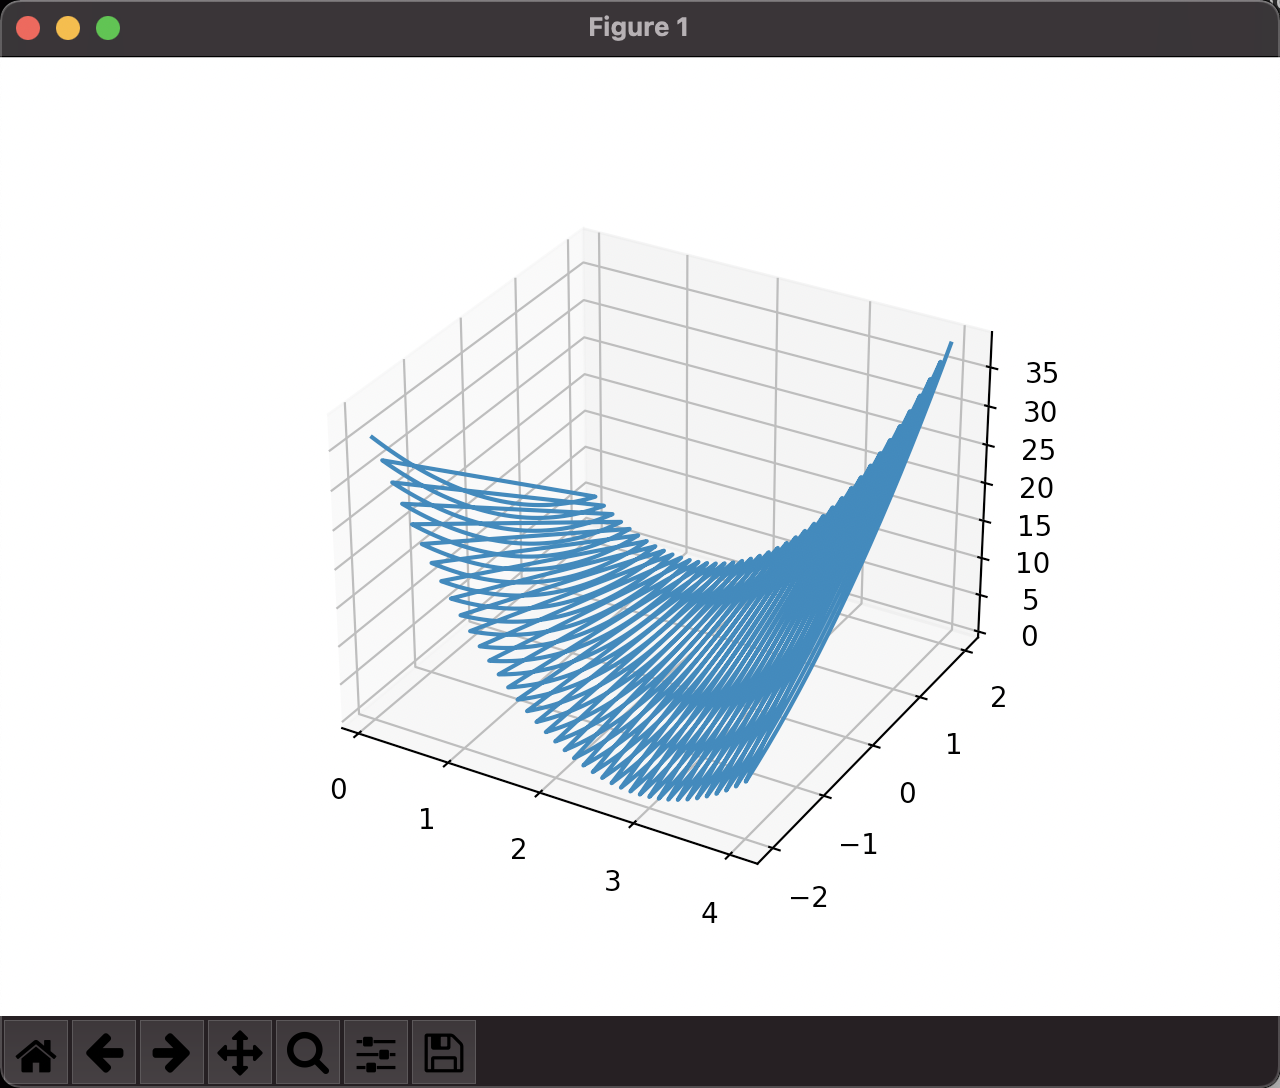
Try to use the model: y = x*w + b, and draw the cost graph.

Tips:

  • You can read the material of how to draw 3d graph. [link]
  • Function np.meshgrid() is very popular for drawing 3d graph, read the [docs] and utilize vectorization calculation.
1
2
3
4
5
6
7
8
9
10
11
12
13
14
15
16
17
18
19
20
21
22
23
24
25
26
27
28
29
30
31
32
33
34
35
36
37
import numpy as np
import matplotlib.pyplot as plt

x_data = [1,2,3]
y_data = [2,4,6]

def forward(x,w,b):
y = x*w+b
return y

def loss(y, y_pred):
loss = (y_pred-y)**2
return loss

w_list = []
b_list = []
mse_list = []
for w in np.arange(0.1, 4.1, 0.1):
for b in np.arange(-2.0, 2.1, 0.1):
print("w:", w, "b:", b)
l_sum = 0
for x_val, y_val in zip(x_data, y_data):
y_pred_val = forward(x_val, w, b)
loss_val = loss(y_val, y_pred_val)
l_sum += loss_val
print("\t", x_val, y_val, y_pred_val, loss_val)
print("MSE=", l_sum/len(x_data))
mse_list.append(l_sum/len(x_data))
w_list.append(w)
b_list.append(b)

fig = plt.figure()
ax = fig.add_subplot(111, projection='3d')
ax.plot3D(w_list, b_list, mse_list)
plt.show()