1
2
3
4
5
6
7
8
9
10
11
12
13
14
15
16
17
18
19
20
21
22
23
24
25
26
27
28
29
30
31
32
33
34
35
36
37
38
39
40
41
42
43
| import matplotlib.pyplot as plt
x_data = [1.0, 2.0, 3.0]
y_data = [2.0, 3.0, 4.0]
w = 1.0
def forward(x):
return w*x
def loss(x, y):
y_pred = forward(x)
return (y_pred - y) **2
def gradient(x, y):
return 2*x*(x*w-y)
epoch_list = []
loss_list = []
print('predict (before training):', 4, forward(4))
for epoch in range(100):
for x, y in zip(x_data, y_data):
l = loss(x, y)
grad = gradient(x, y)
w -= 0.01 * grad
print("\tgradient:", x, y, grad)
print("process: ", epoch, "w=", w, "loss=", l)
epoch_list.append(epoch)
loss_list.append(l)
print("predict (after training)", 4, forward(4))
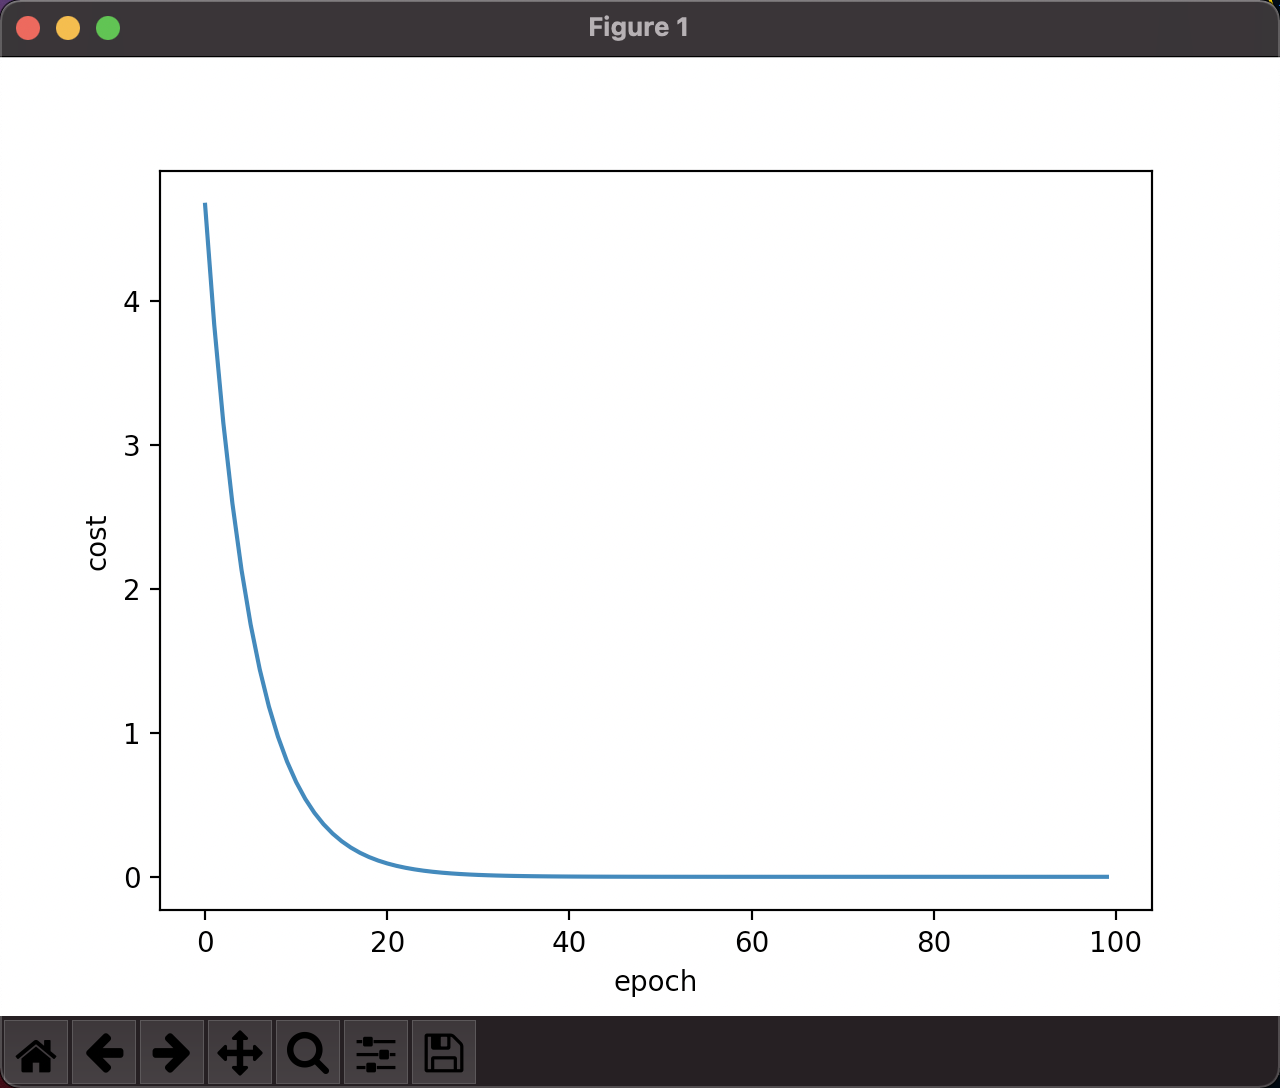
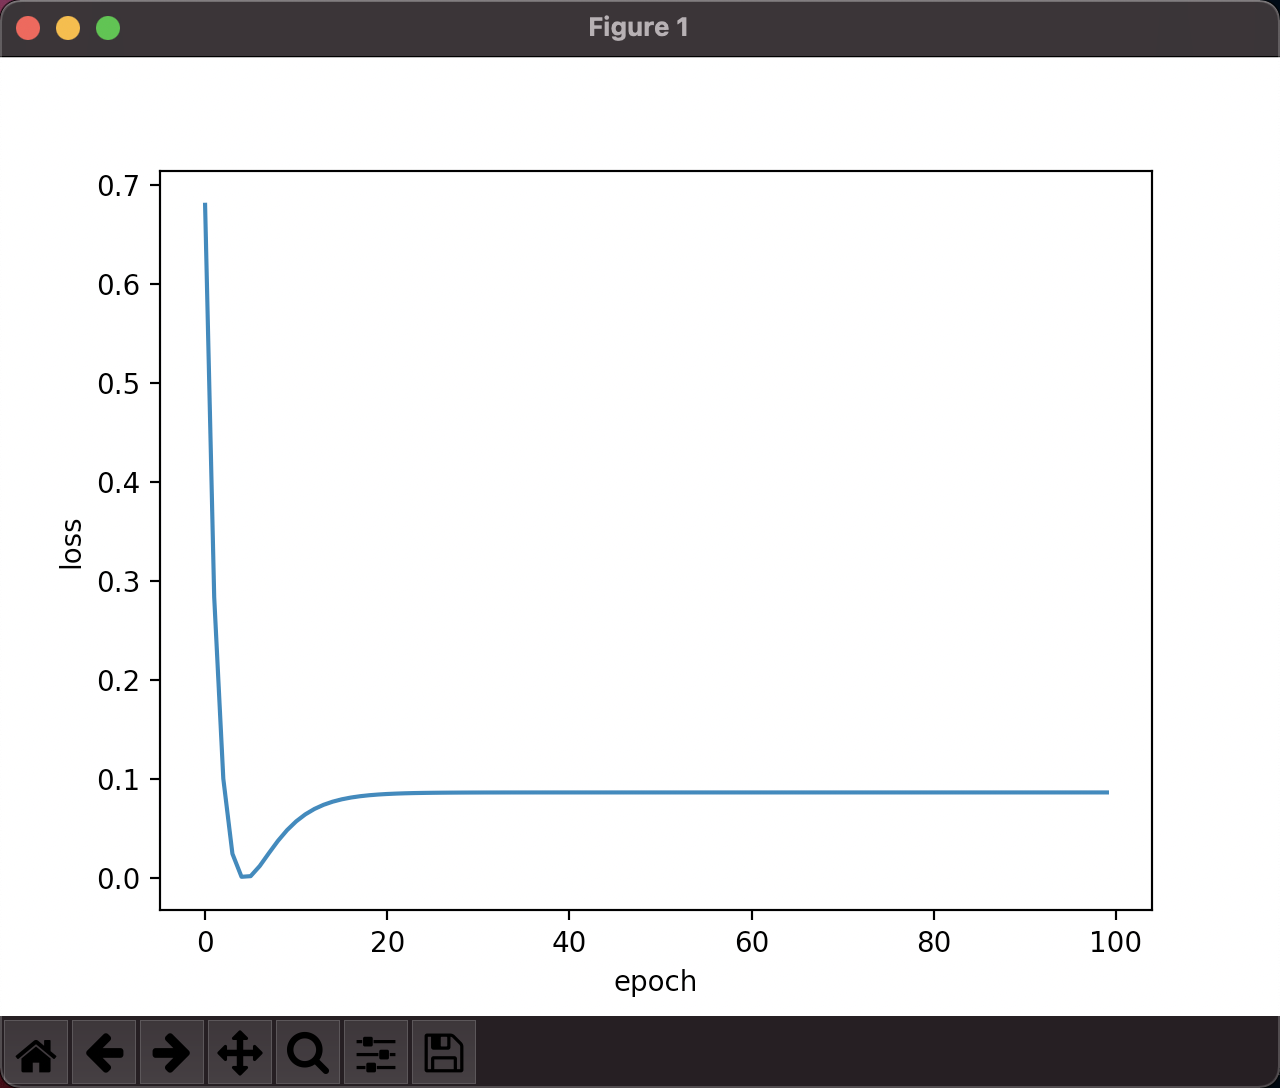
plt.plot(epoch_list, loss_list)
plt.ylabel("loss")
plt.xlabel("epoch")
plt.show()
|


